Developments in artificial intelligence (AI) are leading to fundamental changes in the way we live. Algorithms can already detect Parkinson’s disease and cancer, and control both cars and aircraft. How will AI change our society in the future?This documentary journeys to the hot spots of AI research in Europe, the USA and China, and looks at the revolutionary developments which are currently taking place. The rapid growth of AI offers many opportunities, but also many dangers. AI can be used to create sound and video recordings which will make it more and more difficult to distinguish between fact and fiction. It will make the world of work more efficient and many professions superfluous. Algorithms can decide whether to grant loans, who is an insurance risk, and how good employees are. But there is a huge problem: humans can no longer comprehend how algorithms arrive at their decisions. And another big problem is AI’s capacity for widespread surveillance. The Chinese city of Rongcheng is already using an AI-supported ‘social credit system’ to monitor and assess its citizens. Does AI pose a danger to our personal freedoms or democracy? Which decisions can we leave to the algorithms – and which do we want to? And what are AI’s social implications? A documentary by Tilman Wolff und Ranga Yogeshwar The post Artificial intelligence & algorithms in 2020: pros & cons appeared first on Data Science PR. Via https://datasciencepr.com/artificial-intelligence-algorithms-in-2020-pros-cons/?utm_source=rss&utm_medium=rss&utm_campaign=artificial-intelligence-algorithms-in-2020-pros-cons The market for Data Science has been growing extensively over the recent years. As a result, the position of “data scientist” has established itself as an attractive option for a career path and the competition for job opportunities is steadily increasing.To help you stay at the forefront, 365 Data Science team have conducted a study examining the state of job opportunities in data science. The data for this research come from 1,170 job offers, published across all major US states. From these, 365 Data Science has extracted information about the company offering the position, the required educational credentials and sought-after work experience, as well as the desired skills and techniques a successful data science candidate is expected to have. 365 Data Science notes that all data were extracted automatically and thus, some items may have been incorrectly labelled, assigned or overlooked. The following report analyses all intriguing findings in depth. Let’s get started. 


If you are ready to take the first step towards your data science career, you can experience a structured training program, learn new skills, and practice for the complete set of data science responsibilities here: https://bit.ly/365-data-science-courses The post Data Science Jobs Report 2020 by 365 Data Science appeared first on Data Science PR. Via https://datasciencepr.com/data-science-jobs-report-2020-by-365-data-science/?utm_source=rss&utm_medium=rss&utm_campaign=data-science-jobs-report-2020-by-365-data-science In this tutorial we are going to discuss the Poisson distribution. When we measure the occurrences of an event over a certain period of time or distance, we are often left wondering if what we observe is surprising.The Poisson Distribution helps us determine the likelihood of specific discrete outcomes based on a given historical average number of occurrences. For instance, we know that the average firefly lights up 7 times over the course of 20 seconds. With this distribution we can determine the extent to which it will be out of the norm if it lights up only 4 times during that interval. Being able to spot unusual frequencies of recurring events will help us determine whether something is worrisome or not and if we should further investigate the problem. The post Data Science Tutorial: The Poisson Distribution appeared first on Data Science PR. Via https://datasciencepr.com/poisson-distribution/?utm_source=rss&utm_medium=rss&utm_campaign=poisson-distribution Sometimes, you might set your sights on scraping data you can access only after you log into an account. It could be your channel analytics, your user history, or any other type of information you need. In this case, first check if the company provides an API for the purpose. If it does, that should always be your first choice. If it doesn’t, however, don’t despair. There is still hope. After all, the browser has access to the same tools when it comes to a request as we do. How to Scrape Data That Requires a Login – Important DisclaimerInformation that requires a login to access is generally not public. This means that distributing it or using it for commercial purposes without permission may be a legal violation. So, always make sure to check the legality of your actions first. With that out of the way, let’s walk through the steps to get past the login and scrape data.Depending on the popularity and security measures of the website you are trying to access, signing in can be anywhere between ‘relatively easy’ and ‘very hard’. In most cases, though, it exhibits the following flow.First, when you press the ‘sign in’ button, you are redirected to a log-in page. This page contains a simple HTML form to prompt for ‘username’ (or ‘email’) and ‘password’. When filled out, a POST request, containing the form data, is sent to some URL. The server then processes the data and checks its validity. In case the credentials are correct, most of the time a couple of redirects are chained to finally lead us to some account homepage of sorts. There are a couple of hidden details here, though. First, although the user is asked to fill out only the email and password, the form sends additional data to the server.This data often includes some “authenticity token” which signals that this login attempt is legitimate and it may or may not be required for successful login. The other detail is related to the cookies we mentioned last time.If we successfully signed into our account, client-side cookies are set. Those should be included in each subsequent request we submit. That way, the server knows that we are still logged in and can send us the correct page containing sensitive info. So, how can you do this in practice?The first piece of the puzzle is to find out where the ‘post’ request is sent to and the format of the data. There are a couple of ways to do that. You can either infer that information from the HTML or intercept the requests our browser submits. The majority of login forms are written using the HTML tag ‘form’: 
The URL of the request can be found in an attribute called ‘action’, whereas the parameter fields are contained in the ‘input’ tags. This is important because the hidden parameters will also be placed in input tags and thus can be obtained. Another important piece of information is the name of the input field.As trivial as it may seem, we don’t have that knowledge a priori. For example, think about the username. What should that parameter be called? Well, it might be simply ‘userName’, or it could be called ‘email’, maybe ‘user[email]’. There are many different options, so we should check the one employed by the developers through the ‘name’ attribute. This information can also be obtained by intercepting the browser requests and inspecting them.We do that with the help of the Developer tools. Specifically, in the Chrome developers’ tools, there is a ‘Network’ tab that records all requests and responses. 
Thus, all we need to do is fill our details and log in while the Network tab is open. The original request should be there somewhere with all request and response headers visible, as well as the form data. 
However, bear in mind that it could be buried in a list of many other requests, because of all the redirects and the subsequent fetching of all resources on the page. Now that we’ve got the URL and form details, we can make the POST request.The data can be sent as a regular dictionary. Don’t worry about the subsequent redirects – the requests library deals with that automatically, by default. Of course, this behavior can be changed. But what if we want to then open another page while logged in?Well, we need to set our cookies in advance first. That means we have to take advantage of requests’ sessions. Summarizing all this, a sample code for a simple login may look like this: 
Here we define all the form details, then we create the session and submit the POST request for authentication. Note that the request is made through the session variable, in this case, ‘s’. Some websites employ more complex login mechanisms, but this should suffice for most. The post How To Scrape Data Which is Locked Behind A Login? appeared first on Data Science PR. Via https://datasciencepr.com/how-to-scrape-data-which-is-locked-behind-a-login/?utm_source=rss&utm_medium=rss&utm_campaign=how-to-scrape-data-which-is-locked-behind-a-login Mean reversion refers to the fact that, statistically, the price of an asset should tend back toward the historical average price. Extreme deviations from this price imply overbought or oversold conditions and the likelihood of a reversal.Even for something like Bitcoin, which has really only ever been in a bear market, there can be notable highs or lows that stray from the trajectory the price has historically followed. More often than not, markets will trend back toward this mean price before long. By watching the long-term averages, algorithms can safely bet that massive deviations from these prices are likely not to last for long and set trade orders accordingly. For example, one specific form of this is called standard deviation reversion, and it is measured by an indicator called Bollinger Bands. Basically, these bands act as upward and downward limits on deviations from a central moving average. When the price action moves toward one of these extremes, odds are high that a reversal toward the center is coming soon. Of course, one of the biggest risks here is that the algorithm can’t account for changes in fundamentals. If a market is crashing due to some flaw in the underlying asset, then it is possible the price will actually never recover — or at least not swiftly. This is, again, where traders need to monitor and account for certain conditions that their algorithms cannot see. Another form of mean reversion can occur across multiple assets, and utilizing this technique is called pairs trading. Let’s say, two assets are traditionally correlated. That is, when one goes up or down, then statistically, so does the other. An algorithm can be crafted to watch for one of these assets to make a move, then place a trade based on the likelihood that the other commodity will soon follow. The timeframes for these discrepancies can sometimes be rather short, making the automated nature of this strategy far more valuable. The post What is mean reversion? appeared first on Data Science PR. Via https://datasciencepr.com/what-is-mean-reversion/?utm_source=rss&utm_medium=rss&utm_campaign=what-is-mean-reversion In this video, I will show you how to deploy a machine learning model (a classification model of DHFR dataset) in the R programming language by saving it to disk as a RDS file. Then, we will load back the model by reading the RDS file and make a prediction on the test dataset. The post Machine Learning in R: Deploy Machine Learning Model using RDS appeared first on Data Science PR. Via https://datasciencepr.com/machine-learning-in-r-deploy-machine-learning-model-using-rds/?utm_source=rss&utm_medium=rss&utm_campaign=machine-learning-in-r-deploy-machine-learning-model-using-rds Are you just starting out data science and are looking for an introductory video on the concepts of what it takes to build a machine learning model.Look no further, in this video we cover the basic concepts of the machine learning model building process. The concept of this video first started out as a drawn infographic and is now converted to a video format. The post Data Science 101: Overview of Machine Learning Model Building Process appeared first on Data Science PR. Via https://datasciencepr.com/data-science-101-overview-of-machine-learning-model-building-process/?utm_source=rss&utm_medium=rss&utm_campaign=data-science-101-overview-of-machine-learning-model-building-process Are you bored of the Iris dataset?In this video, I will be showing how you can use the Penguins dataset as an alternative to the Iris dataset for learning and teaching data science. The Penguins dataset has similar characteristics to the Iris dataset while also having its own unique strengths that will augment your learning experience. Palmer Penguins Dataset
The post Penguins Dataset as Alternative to Iris Dataset for Data Science appeared first on Data Science PR. Via https://datasciencepr.com/penguins-dataset-as-alternative-to-iris-dataset-for-data-science/?utm_source=rss&utm_medium=rss&utm_campaign=penguins-dataset-as-alternative-to-iris-dataset-for-data-science Wrangle and Explore Data with PANDAS-UI for Data ScienceIn this video, I will provide an overview of the pandas-ui Python library that you can use to wrangle data and perform exploratory data analysis for your data science projects. Under the hood, pandas-ui integrates several libraries including pandas, NumPy, plotly, ipywidgets, pandas_profiling and qgrid. The post Wrangle and Explore Data with PANDAS-UI for Data Science appeared first on Data Science PR. Via https://datasciencepr.com/wrangle-and-explore-data-with-pandas-ui-for-data-science/?utm_source=rss&utm_medium=rss&utm_campaign=wrangle-and-explore-data-with-pandas-ui-for-data-science Have you ever wanted to build a web app for your data science project? But perhaps did not because of the extensive time needed to code the web app or intimidated by Django and flask? In this video, I will show you how to build an (intermediate level of difficulty) machine learning powered data science web app in Python using the streamlit library in a little over 100 lines of code. Particularly, we will be building a Penguins species classification web app using the Palmer Penguins dataset (4 quantitative variables and 3 qualitative variables; 1 of the qualitative variable will be used as the target variable for classification). The post Streamlit Tutorial Part 3: How to Build a Penguin Classification Web App in Python appeared first on Data Science PR. Via https://datasciencepr.com/streamlit-tutorial-part-3-how-to-build-a-penguin-classification-web-app-in-python/?utm_source=rss&utm_medium=rss&utm_campaign=streamlit-tutorial-part-3-how-to-build-a-penguin-classification-web-app-in-python With this data map, circles are displayed over a designated geographical region with the area of the circle proportional to its value in the dataset.Bubble Maps are good for comparing proportions over geographic regions without the issues caused by regional area size, as seen on Choropleth Maps. However, a major flaw with Bubble Maps is that overly large bubbles can overlap other bubbles and regions on the map, so this needs to be accounted for. The post Data Visualization Explained: Bubble Map appeared first on Data Science PR. Via https://datasciencepr.com/bubble-map/?utm_source=rss&utm_medium=rss&utm_campaign=bubble-map Statistics you need in the office: Descriptive & Inferential statistics, Hypothesis testing, Regression analysis.What you’ll learn
Requirements
Description Is statistics a driving force in the industry you want to enter? Do you want to work as a Marketing Analyst, a Business Intelligence Analyst, a Data Analyst, or a Data Scientist? Well then, you’ve come to the right place! Statistics for Data Science and Business Analysis is here for you with TEMPLATES in Excel included! This is where you start. And it is the perfect beginning! In no time, you will acquire the fundamental skills that will enable you to understand complicated statistical analysis directly applicable to real-life situations. We have created a course that is:
It is no secret that a lot of these topics have been explained online. Thousands of times. However, it is next to impossible to find a structured program that gives you an understanding of why certain statistical tests are being used so often. Modern software packages and programming languages are automating most of these activities, but this course gives you something more valuable – critical thinking abilities. Computers and programming languages are like ships at sea. They are fine vessels that will carry you to the desired destination, but it is up to you, the aspiring data scientist or BI analyst, to navigate and point them in the right direction. Teaching is our passion We worked hard for over four months to create the best possible Statistics course which would deliver the most value to you. We want you to succeed, which is why the course aims to be as engaging as possible. High-quality animations, superb course materials, quiz questions, handouts and course notes, as well as a glossary with all new terms you will learn, are just some of the perks you will get by subscribing. What makes this course different from the rest of the Statistics courses out there?
Why do you need these skills?
Please bear in mind that the course comes with Udemy’s 30-day unconditional money-back guarantee. And why not give such a guarantee? We are certain this course will provide a ton of value for you. Let’s start learning together now! Who this course is for:
Join now!The post Statistics for Data Science and Business Analysis appeared first on Data Science PR. Via https://datasciencepr.com/statistics-for-data-science-and-business-analysis/?utm_source=rss&utm_medium=rss&utm_campaign=statistics-for-data-science-and-business-analysis How to Build a Profitable and Winning Company Using Business Analytics.What you’ll learn
Requirements
Description When can we say that a business is successful? Which are the techniques corporations use to monitor their performance? What makes for an effective analytics project? If these questions sound interesting and you want to learn about business analytics, then you’ve come to the right place. This course is an invaluable journey, in which we will layout the foundations of your superior business analytics skills. You will start developing abilities that are highly necessary in any type of business environment, but particularly so when working for a large blue-chip corporation -running a complex business. In this course, you will learn how to: – Define business expectations – Distinguish between a long-range plan and an annual business plan – Perform stakeholder mapping – Understand what business intelligence is and why it is essential for every modern company – Carry out end-to-end process mapping – Become familiar with the main types of end-to-end processes in a corporation: Hire-to-Retire (H2R), Record-to-Report (R2R), Order-to-Cash (O2C), Source-to-Pay (S2P) – Identify key value drivers – What are metrics and what distinguished metrics and KPIs – Perform internal and external benchmarking – Understand the importance of the Master data function – Carry out historical analysis, variance analysis, trend analysis, value-based analysis, correlation, time series, regression, as well as machine and deep learning analysis – Determine which is the most appropriate type of analysis depending on the problem at hand – Acquire an understanding of how to manage an analytics project – Gain an understanding of what makes for a successful analytics project All of this will be taught by an instructor with world-class experience. Randy Rosseel has worked in the Coca-Cola ecosystem for a bit more than 16 years. He has been a business controller, а senior manager of planning and consolidation, an associate director of planning and performance management; and, ultimately, a director of finance responsible for hundreds of employees. Each of the topics in the course builds on the previous ones. And you risk getting lost along the way if you do not acquire these skills in the right order. For example, one would struggle to understand how to identify KPIs if they are not introduced to Stakeholder and end-to-end process mapping first. So far, we have not seen other comparable training programs online. We believe that this is a unique opportunity to learn from a proven professional who has 360 degrees view of the analytics processes in one of the most recognizable companies in the world. What you get
And we are happy to offer an unconditional 30-day money-back in full guarantee. No risk for you. The content of the course is excellent, and this is a no-brainer for us, as we are certain you will love it. Why wait? Every day is a missed opportunity. Click the “Buy Now” button and become a part of our business analytics program today.Who this course is for:
Join now!The post Introduction to Business Analytics 2020 appeared first on Data Science PR. Via https://datasciencepr.com/introduction-to-business-analytics-2020/?utm_source=rss&utm_medium=rss&utm_campaign=introduction-to-business-analytics-2020 The #1 Course to Land a Job in Investment Banking. IPOs, Bonds, M&A, Trading, LBOs, Valuation: Everything is included!What you’ll learn
Requirements
Description ** Updated for June 2020 ** The Complete Investment Banking Course 2020 is the most hands-on, interactive and dynamic investment banking course you will find online. + 64 Pages of Course Notes + 12 Course Challenges + 26 PDF Files + 22 Quiz Questions + 32 Excel files + A complete Glossary with key terms and phrases + Real-world examples and case studies + Interesting facts about the industry + 2 Valuation models built from scratch + 5 hours of Full-HD video The course starts off by introducing you to the four main areas of investment banking – Capital Markets, Advisory, Trading and Brokerage, and Asset Management. Then we continue by digging deeper into each line of business. You will learn the subtleties of Initial Public Offerings, Seasoned Equity Offerings, Private Placements, Bond Issuances, Loan Syndications, Securitizations, Mergers & Acquisitions, Restructurings, Trading Instruments, Asset Management Vehicles and more. Pretty much everything that can come up in an investment banking interview. However, the best part is that you will learn different valuation techniques like the ones used by Goldman Sachs, Morgan Stanley and J.P. Morgan. We will show you how to carry out a Discounted Cash Flow valuation, a multiples valuation, and a Leveraged buyout valuation. You will estimate a company’s cost of capital and future cash flows. Don’t worry if these sound unfamiliar right now; everything is shown in the course – step-by-step – with no steps skipped. This is a one-stop-shop, providing everything you need to land a job on Wall Street. What makes this course different from the rest of the Finance courses out there?
Why should you consider a career as an Investment Banker?
Please don’t forget that the course comes with Udemy’s 30-day unconditional money-back-in-full guarantee. And why not give such a guarantee, when we are convinced that the course will provide a ton of value for you? Just go ahead and subscribe to this course! If you don’t acquire these skills now, you will miss an opportunity to separate yourself from the others. Don’t risk your future success! Let’s start learning together now!
Join now!The post The Complete Investment Banking Course 2020 appeared first on Data Science PR. Via https://datasciencepr.com/the-complete-investment-banking-course-2020/?utm_source=rss&utm_medium=rss&utm_campaign=the-complete-investment-banking-course-2020 SQL that will get you hired – SQL for Business Analysis, Marketing, and Data Management.What you’ll learn
Requirements
Description How important is database management in the age of big data and analytics? It is really important. How many employers would be happy to hire employees who can use data for the purposes of business intelligence? All of them. How many people have these skills? Not enough. This is why now is the time to learn SQL and gain a competitive advantage in the job market. Remember, the average salary of a SQL developer is $92,000! That’s a lucrative career. How come? Well, when you can work with SQL, it means you don’t have to rely on others sending you data and executing queries for you. You can do that on your own. This allows you to be independent and dig deeper into the data to obtain the answers to questions that might improve the way your company does its business. For instance, Database management is the foundation for data analysis and intelligent decision making. Worried that you have no previous experience? Not an issue. We will start from the very basics and gradually teach you everything you need to know. Step by step. With no steps skipped. Why take this course in particular? Isn’t it like the rest of the SQL courses out there? We would like to think it isn’t. Our team worked hard to create a course that is:
Some of these aspects have been covered in other courses. Others haven’t. However, no one provides such a variety of topics in one place. We firmly believe this course is the best training material out there. It is a truly interactive experience preparing you for a real-life working environment. We love teaching So far, over 210,000 students have enrolled in our courses here on Udemy. Teaching is what we do best, and we take pride in going the extra mile to create the best content for you, our students. Our mission is to help you bridge the gap between theoretical knowledge taught at school and in universities and the practical application required at the workplace. So, why do you need to enroll in this course and learn SQL?
What about certificates? Do you provide a certificate? Upon completion of the course, you will be able to download a certificate of completion with your name on it. Then, you can upload this certificate on LinkedIn and show potential employers this is a skill you possess. Sounds awesome, right? So, what are you waiting for? Click the “Take this course” button, and let’s begin this journey together! Who this course is for:
Join now!The post SQL – MySQL for Data Analytics and Business Intelligence appeared first on Data Science PR. Via https://datasciencepr.com/sql-mysql-for-data-analytics-and-business-intelligence/?utm_source=rss&utm_medium=rss&utm_campaign=sql-mysql-for-data-analytics-and-business-intelligence Learn Python Programming and Conduct Real-World Financial Analysis in Python – Complete Python TrainingWhat you’ll learn
Requirements
Description Do you want to learn how to use Python in a working environment? Are you a young professional interested in a career in Data Science? Would you like to explore how Python can be applied in the world of Finance and solve portfolio optimization problems? If so, then this is the right course for you! We are proud to present Python for Finance: Investment Fundamentals and Data Analytics – oneof the mostinteresting and complete courses we have created so far. It took our team slightly over four months to create this course, but now, it is ready and waiting for you. An exciting journey from Beginner to Pro. If you are a complete beginner and you know nothing about coding, don’t worry! We start from the very basics. The first part of the course is ideal for beginners and people who want to brush up on their Python skills. And then, once we have covered the basics, we will be ready to tackle financial calculations and portfolio optimization tasks. Finance Fundamentals. And it gets even better! The Finance block of this course will teach you in-demand real-world skills employers are looking for. To be a high-paid programmer, you will have to specialize in a particular area of interest. In this course, we will focus on Finance, covering many tools and techniques used by finance professionals daily:
Everything is included! All these topics are first explained in theory and then applied in practice using Python. Is there a better way to reinforce what you have learned in the first part of the course? This course is great, even if you are an experienced programmer, as we will teach you a great deal about the finance theory and mechanics you will need if you start working in a finance context. Teaching is our passion. Everything we teach is explained in the best way possible. Plain and clear English, relevant examples and time-efficient videos. Don’t forget to check some of our sample videos to see how easy they are to understand. If you have questions, contact us! We enjoy communicating with our students and take pride in responding within the 1 business day. Our goal is to create high-end materials that are fun, exciting, career-enhancing, and rewarding. What makes this course different from the rest of the Programming and Finance courses out there?
Please don’t forget that the course comes with Udemy’s 30-day unconditional, money-back-in-full guarantee. And why not give such a guarantee, when we are convinced the course will provide a ton of value for you? Just subscribe to this course! If you don’t acquire these skills now, you will miss an opportunity to separate yourself from the others. Don’t risk your future success! Let’s start learning together now!Who this course is for:
Join nowThe post Python for Finance: Investment Fundamentals & Data Analytics appeared first on Data Science PR. Via https://datasciencepr.com/python-for-finance-investment-fundamentals-data-analytics/?utm_source=rss&utm_medium=rss&utm_campaign=python-for-finance-investment-fundamentals-data-analytics Momentum trading is based around the logic that if a predominant trend is already visible in the market, then that trend is plausibly going to continue at least until signals begin to come in that it has ended.The idea with momentum trading is that if a certain asset has been moving primarily in one direction for, say, several months, then we can safely assume this trend will continue, at least until data starts to show otherwise. Therefore, the plan will be to buy on every dip and lock in profits on every pump, or vice versa if shorting. Of course, traders need to be aware of when a market shows signs of trend reversals, or else this same strategy could begin to turn around pretty fast. It should also be noted that traders shouldn’t set strategies that try to buy and sell on the actual lows and highs, or what is called “catching the knife,” but rather lock in profits and buy back in at levels that are reasonably safe. Algorithmic trading is ideal for this, as users can simply set percentages they feel comfortable with and let the code do the rest. This technique on its own, however, can be ineffective if a market is moving sideways or so volatile that a clear trend has not emerged. One excellent indicator for watching trends is moving averages. Just as they sound, a moving average is a line on a price chart that shows the average price for an asset over x amount of days (or hours, weeks, months, etc.). Often, amounts like 50, 100 or 200 are used, but different strategies look at different time periods in order to make their trade predictions. Generally, a trend is thought of as strong when it stays well above or below a moving average — and weak when it approaches or crosses over the MA line. In addition, MAs based upon longer time periods are generally given a lot more weight than one that only watches, say, the last 100 hours or a similar timeframe. The post What is momentum trading? appeared first on Data Science PR. Via https://datasciencepr.com/what-is-momentum-trading/?utm_source=rss&utm_medium=rss&utm_campaign=what-is-momentum-trading Created in 2009 by a four-person team and unveiled to the public in 2012, Julia is meant to address the shortcomings in Python and other languages and applications used for scientific computing and data processing. “We are greedy,” they wrote.Here are some of the ways Julia implements those aspirations:
Source: InfoWorld The post What is the Julia language? appeared first on Data Science PR. Via https://datasciencepr.com/julia-language-explained/?utm_source=rss&utm_medium=rss&utm_campaign=julia-language-explained Financial Modeling in Excel that would allow you to walk into a job and be a rockstar from day one!What you’ll learn
Requirements
Description **Updated for June 2020!** Do you want to learn how to use Excel in a real working environment? Are you about to graduate from university and start looking for your first job? Are you a young professional looking to establish yourself in your new position? Would you like to become your team’s go-to person when it comes to Financial Modeling in Excel? If you answered yes to any of these, then this is the right course for you! Join over 119,002 successful students taking this course! The instructor of this course has extensive experience in Financial Modeling:
Learn the subtleties of Financial Modeling from someone who has walked the same path. Beat the learning curve and stand out from your colleagues. A comprehensive guide to Financial Modeling in Excel:
What we offer:
By completing this course, you will:
About the course:
Make an investment that will be highly rewarded in career prospects, positive feedback, and personal growth. This course is suitable for graduates who aspire to become investment bankers as it includes a well-structured DCF model and goes through the theoretical concepts behind it. Moreover, it will encourage you to be more confident when coping with daily tasks and will give you the edge when the firm must decide whether to take you on for a full-time position. People with basic knowledge of Excel who go through the course will dramatically increase their Excel skills. Go ahead and subscribe to this course! If you don’t acquire these skills now, you will miss an opportunity to separate yourself from others. Don’t risk your future success! Let’s start learning together now! Who this course is for:
Join now!The post Beginner to Pro in Excel: Financial Modeling and Valuation appeared first on Data Science PR. Via https://datasciencepr.com/best-financial-modeling-course/?utm_source=rss&utm_medium=rss&utm_campaign=best-financial-modeling-course Data scientists and ML engineers can now speedup their applications using the power of FPGA accelerators from their browser.FPGAs are adaptable hardware platforms that can offer great performance, low-latency and reduced OpEx for applications like machine learning, video processing, quantitative finance, etc. However, the easy and efficient deployment from users with no prior knowledge on FPGA was challenging. InAccel, a pioneer on application acceleration, makes accessible the power of FPGA acceleration from your browser. Data scientists and ML engineers can now easily deploy and manage FPGAs, speeding up compute-intense workloads and reduce total cost of ownership with zero code changes.
Through the JupyterHub integration, users can now enjoy all the benefits that JupyterHub provide such as easy access to computational environment for instant execution of Jupyter notebooks. At the same time, users can now enjoy the benefits of FPGAs such as lower-latency, lower execution time and much higher performance without any prior-knowledge of FPGAs. InAccel’s framework allows the use of Xilinx’s Vitis Open-Source optimized libraries or 3rd party IP cores (for machine learning, data analytics, genomics, compression, encryption and computer vision applications.) The Accelerated Machine Learning Platform provided by InAccel’s FPGA orchestrator can be used either on-prem or on cloud. That way, users can enjoy the simplicity of the Jupyter notebooks and at the same time experience significant speedups on their applications. Users can test for free the available libraries on the InAccel cluster using the following link: https://inaccel.com/accelerated-data-science/ The platform is available for demonstration purposes. Multiple users may access the available cluster with the 2 Alveo cards. Source: Inside Big Data The post Accelerated Machine Learning from Your Browser in 2020 appeared first on Data Science PR. Via https://datasciencepr.com/accelerated-machine-learning-browser/?utm_source=rss&utm_medium=rss&utm_campaign=accelerated-machine-learning-browser As Zoom approaches the end of its self-imposed 90-day period to put in place a comprehensive security and privacy policy, the company announced on Wednesday that it’s hired a head of security from Salesforce.Jason Lee, who has spent almost three years as senior vice president of security operations at Salesforce, is joining Zoom as chief information security officer, starting June 29, the company said in a press release. Lee previously spent 15 years at Microsoft. The hiring of a security chief is CEO Eric Yuan’s latest move to strengthen Zoom’s security offerings after the company saw an explosion in user growth from the surge in office-based employees working from home and an unexpected increase in attention. On April 1, Zoom announced a 90-day plan to fix security flaws that included “zoombombings” from unwelcome guests on video conferences and the sharing of users’ personal data with Facebook. In early April, Yuan hired former Facebook security chief Alex Stamos as a consultant to help the company beef up its efforts, and a month later Zoom acquired start-up Keybase to add end-to-end encryption to video calls. “Zoom is on an incredible journey of growth and I am thrilled to bring my experience of running world-class security organizations to the company,” Lee said in the statement. “Ensuring that customers trust our products is of the utmost importance and I look forward to working with the team to continue instilling security into the DNA of Zoom.” Lee will report to Chief Operating Officer Aparna Bawa. The post Zoom hires a top security executive from Salesforce appeared first on Data Science PR. Via https://datasciencepr.com/zoom-hires-executive-salesforce/?utm_source=rss&utm_medium=rss&utm_campaign=zoom-hires-executive-salesforce What if I told you that you could learn over 24 different tech skills, worth thousands of dollars in real-world value, for a fraction of the cost? Specifically 94% off what they originally cost?Well, that’s EXACTLY what’s happening inside the 2020 version of the Ultimate Tech Career Toolbox. After many long days and nights of negotiating and planning, we’ve been able to get 27 expert technical course creators to say “yes,” and help make that vision of mine a reality. I’m so excited to share what we’ve put together. In this post, you’ll find a detailed breakdown of every single product you’ll get in this year’s toolbox. If you went out and purchased all these products on your own, it would cost $4,206! Here’s the catch…this deal is so good that it’s only going to be available for five days: Monday, June 22nd to Friday, June 26th. Keep reading to see everything you’ll get inside! Sign up now: https://bit.ly/toolbox2020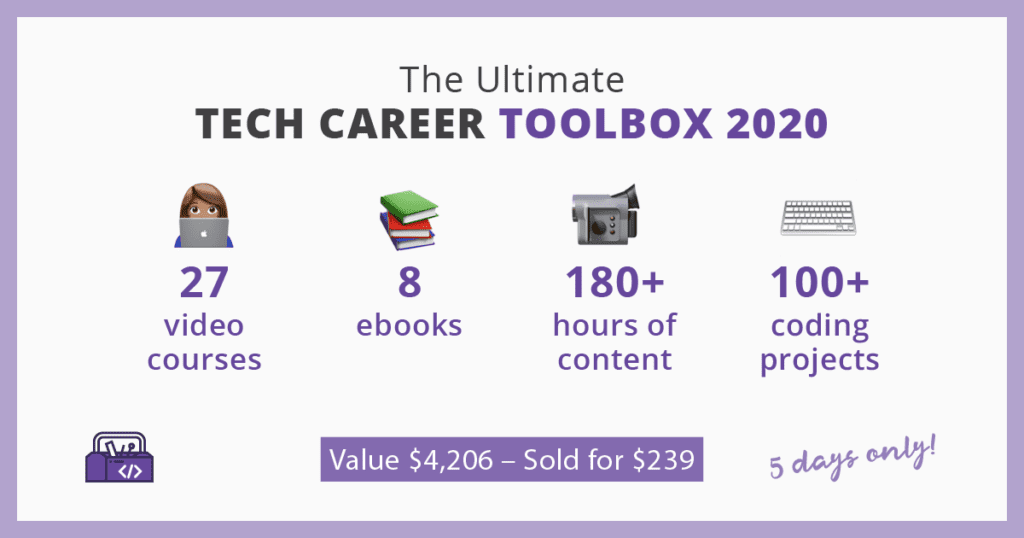
All The Products Inside the 2020 Ultimate Tech Career Toolbox
The post 33 Different Products to Level Up Your Tech Skills in 2020 appeared first on Data Science PR. Via https://datasciencepr.com/24-different-tech-skills-bundle/?utm_source=rss&utm_medium=rss&utm_campaign=24-different-tech-skills-bundle Reddit has named Y Combinator CEO Michael Seibel to its board of directors. In addition to running the well-known accelerator, Seibel also co-founded the live streaming company Justin.tv before it transformed into Twitch. Justin.tv was an early recipient of Y Combinator seed money through the accelerator’s startup fund, as was Reddit. (Seibel also co-founded Socialcam and sold it to Autodesk in 2012.) Seibel is replacing co-founder and board member Alexis Ohanian, who stepped down from the company’s board of directors last week and asked to be replaced by a black candidate. Seibel was Y Combinator’s first black partner prior to becoming CEO, and he has supported a number of initiatives to increase diversity in the tech industry, including BlackTech4BlackLives and Black Tech Weekend. “I want to thank Steve, Alexis, and the entire Reddit board for this opportunity. I’ve known Steve and Alexis since 2007 and have been a Reddit user ever since,” Seibel said in a statement. “Over this period of time I’ve watched Reddit become part of the core fabric of the internet and I’m excited to help provide advice and guidance as Reddit continues to grow and tackle the challenges of bringing community and belonging to a broader audience.” Ohanian resigned from Reddit, where he was a board member but not involved in day-to-day operations, amid a broader conversation about the platform’s stance on racism and hate speech and ways to advance diversity and combat racial injustice in the tech industry. The conversation began following Reddit CEO Steve Huffman’s post addressing the killing of George Floyd and the ongoing protests against police brutality and racism, in which the chief executive said the Reddit community does “not tolerate hate, racism, and violence.” The note sparked criticism from former CEO Ellen Pao, who characterized Huffman’s words as hypocritical. “So much of what is happening now lies at your feet,” Pao said of Huffman’s failure to ban hate speech and moderate or remove its more toxic communities. “You don’t get to say BLM when reddit nurtures and monetizes white supremacy and hate all day long.” Numerous subreddits went dark earlier in the week to honor Floyd and to further protest Reddit’s handling of racism. Many moderators of prominent subreddits echoed Pao’s comments and called out Huffman for failing to take action against hateful communities like the pro-Trump subreddit r/The_Donald and others. “Reddit has harbored racists as policy for years,” read a note posted by the moderators of r/NFL. (For a deeper look at Reddit’s controversial history of volunteer-based moderation, read the dedicated column about it in The Verge’s Interface here.) Ohanian didn’t comment on his co-founder’s tenure upon departing from the board. But he did say that leaving the board “is long overdue to do the right thing.” He went on to say he would use his future gains on Reddit stock “to serve the black community, chiefly to curb racial hate,” and that he was donating $1 million to former NFL player and activist Colin Kaepernick’s Know Your Rights Camp education organization. Huffman acknowledged the criticism late last week in a separate note announcing Ohanian’s decision to step down. “Earlier this week, I wrote an email to our company addressing this crisis and a few ways Reddit will respond. When we shared it, many of the responses said something like, ‘How can a company that has faced racism from users on its own platform over the years credibly take such a position?’ Huffman said. “These questions, which I know are coming from a place of real pain and which I take to heart, are really a statement: There is an unacceptable gap between our beliefs as people and a company, and what you see in our content policy.” Huffman said at the time that in addition to honoring Ohanian’s wishes to be replaced by a black candidate, the company would also update its content policy to “include a vision for Reddit and its communities to aspire to, a statement on hate, the context for the rules, and a principle that Reddit isn’t to be used as a weapon.” Reddit plans to do so in the coming months after gathering moderator feedback. Source: TheVerge The post Reddit names Y Combinator CEO Michael Seibel as Alexis Ohanian’s replacement appeared first on Data Science PR. Via https://datasciencepr.com/reddit-names-y-combinator-ceo-michael-seibel-as-alexis-ohanians-replacement/?utm_source=rss&utm_medium=rss&utm_campaign=reddit-names-y-combinator-ceo-michael-seibel-as-alexis-ohanians-replacement A Bubble Chart is a multi-variable graph that is a cross between a Scatterplot and a Proportional Area Chart.Like a Scatterplot, Bubble Charts use a Cartesian coordinate system to plot points along a grid where the X and Y axis are separate variables. However. unlike a Scatterplot, each point is assigned a label or category (either displayed alongside or on a legend). Each plotted point then represents a third variable by the area of its circle. Colours can also be used to distinguish between categories or used to represent an additional data variable. Time can be shown either by having it as a variable on one of the axis or by animating the data variables changing over time. Bubble Charts are typically used to compare and show the relationships between categorised circles, by the use of positioning and proportions. The overall picture of Bubble Charts can be used to analyse for patterns/correlations. Too many bubbles can make the chart hard to read, so Bubble Charts have a limited data size capacity. This can be somewhat remedied by interactivity: clicking or hovering over bubbles to display hidden information, having an option to reorganise or filter out grouped categories. Like with Proportional Area Charts, the sizes of the circles need to be drawn based on the circle’s area, not its radius or diameter. Not only will the size of the circles change exponentially, but this will lead to misinterpretations by the human visual system. 
The post Data Visualization Explained: Bubble Chart appeared first on Data Science PR. Via https://datasciencepr.com/data-visualization-explained-bubble-chart/?utm_source=rss&utm_medium=rss&utm_campaign=data-visualization-explained-bubble-chart Algorithmic trading looks to remove the human factor and instead follows predetermined, statistics-based strategies that can be run 24/7 by computers with minimal oversight.Computers can offer multiple advantages over human traders. For one, they can stay active all day, every day without sleep. They can also analyze data precisely and respond to changes in milliseconds. To top it off, they never factor emotion into their decisions. Because of this, many investors have long since realized that machines can make excellent traders, given that they are using the correct strategies. This is how the field of algorithmic trading has evolved. While it began with computers trading in traditional markets, the rise of digital assets and 24/7 exchanges has brought this practice to a new level. It almost seems as if automated trading and cryptocurrencies were made for each other. It’s true that users will still have to work out their own strategies, but when applied correctly, these techniques can help traders take their hands off of the wheel and let mathematics do the work. The post What is algorithmic trading? appeared first on Data Science PR. Via https://datasciencepr.com/what-is-algorithmic-trading/?utm_source=rss&utm_medium=rss&utm_campaign=what-is-algorithmic-trading |
DataSciencePRData Science PR is the leading global niche data science press release services provider. 
Archives |
 Data Dimension/Size: 344 Rows and 7 Columns
 RSS Feed
